Intra-GMS Trade
Intra-GMS trade has significantly increased in PRC, Thailand and Viet Nam especially after 2009; and gently increased in Cambodia, Lao PDR and Myanmar except in 2015 for Lao PDR and Myanmar
Intraregional trade share = (Tii/Ti) x 100 where Tii is intraregional trade, i.e., exports of region i to region i plus imports of region i from region i; and Ti =total exports of region i to the world plus total imports of region i from the world. Intra-GMS trade is Tii.
GMS = Greater Mekong Subregion, PRC = People's Republic of China, Lao PDR = Lao People's Democratic Republic Source: GMS Secretariat estimates using data from UNCOMTRADE. https://comtrade.un.org (accessed May 2017). http://www.greatermekong.org/statistics/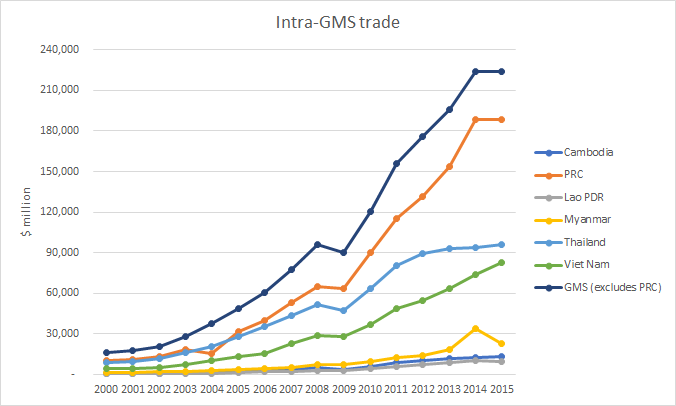
Agriculture Value Added (% of GDP)
Proportion of Gross Agriculture Value Added has slightly decreased in most of the GMS nations in the last 5 years as per % of GDP
Agriculture corresponds to ISIC divisions 1-5 and includes forestry, hunting, and fishing, as well as cultivation of crops and livestock production. Value added is the net output of a sector after adding up all outputs and subtracting intermediate inputs. It is calculated without making deductions for depreciation of fabricated assets or depletion and degradation of natural resources. The origin of value added is determined by the International Standard Industrial Classification (ISIC), revision 3.
Note: For VAB countries, gross value added at factor cost is used as the denominator. Data Source: World Development Indicators (https://data.worldbank.org/) https://data.worldbank.org/ Last Updated Date: 2 08 2017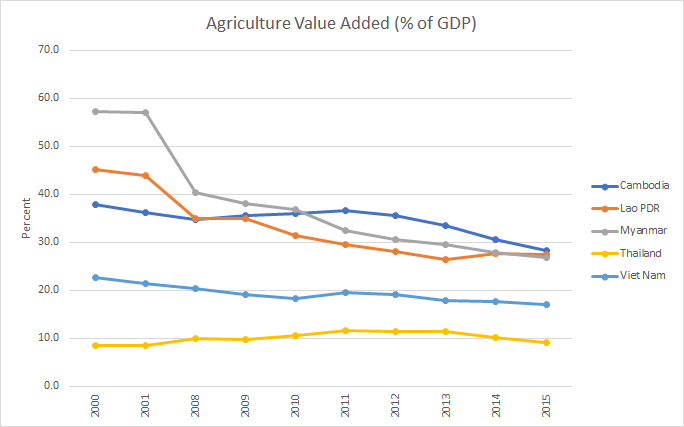
GDP Growth Rate of GMS (weighted by GDP at PPP current international dollars) 2000-2015
GPD growth rate in all GMS countries reached to the lowest in 2009 over the past 15 years; and much improved in the later year, but still could not make a decent progress in the last few years.
GDP growth rate is % change of constant GDP in local currency unit, year-on-year.
The GMS GDP growth rates use GDP rather than GNI shares as weights since Guangxi and Yunnan do not have GNI estimates. ( ) = negative, GDP = gross domestic product, GNI = gross national income, GMS = Greater Mekong Subregion, Lao PDR = Lao People's Democratic Republic, PRC = People's Republic of China, PPP = purchasing power parity. From 1992 to 1996, the GMS GDP growth rate excludes Myanmar's weight: No estimates of PPP conversion factor are available. Constant GDP of Guangxi and Yunnan, in local currency unit, is estimated by using PRC's implicit GDP deflator. Sources: GMS Secretariat estimates using data from the Asian Development Bank Statistical Database System. https://sdbs.adb.org. (accessed December 2016); Guangxi Statistical Bureau. 2016. Guangxi Statistical Yearbook. Beijing: [People's Republic of] China Statistics Press; International Monetary Fund World Economic Outlook Database. https://www.imf.org/external/pubs/ft/weo/2016/01/weodata/index.aspx (accessed February 2017); World Bank. World Development Indicators Database. http://data.worldbank.org/data-catalog/world-development-indicators (accessed February 2017); Statistical Bureau of Yunnan Province. 2016. Yunnan Statistical Yearbook. Beijing: [People's Republic of] China Statistics Press. http://www.greatermekong.org/statistics/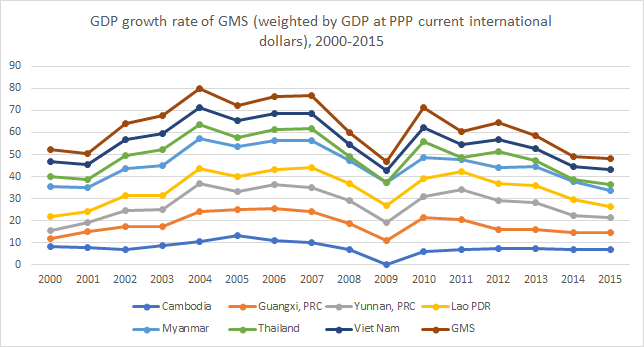
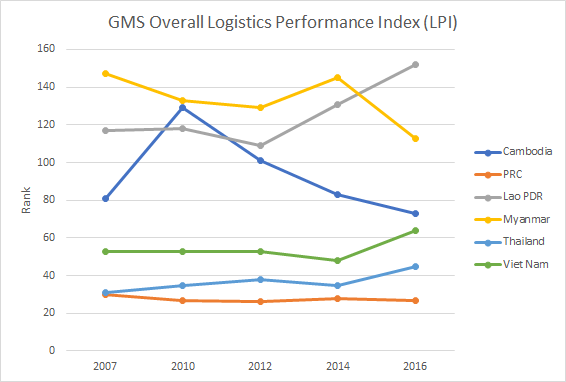
GMS Overall Logistics Performance Index (LPI)
Logistic Performance Index for Cambodia, Myanmar and PRC noteworthy improved; while Lao PDR, Thailand and Viet Nam declined in 2016
The overall LPI rank is based on the overall LPI score. LPI score is a summary indicator of logistics sector performance, combining data on six core performance components that measure logistics supply chain performance within a country into a single measure. The six components are
- ability to track and trace consignments
- competence and quality of logistics services
- ease of arranging competitively-priced shipments
- efficiency of customs clearance process
- frequency with which shipments reach consignee, and
- quality of trade and transport-related infrastructure.
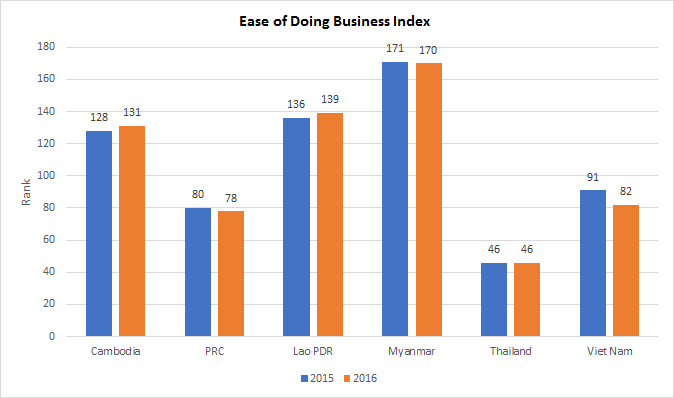
Ease of Doing Business Index
Ease of Doing Business Index significantly improved for Viet nam and slightly progressed for PRC and Myanmar; Cambodia and Lao PDR ranked higher in 2016; and the rank of Thailand maintained as last year.
Description: Ease of doing business ranks economies from 1 to 190, with first place being the best. A high ranking (a low numerical rank) means that the regulatory environment is conducive to business operation. The index averages the country's percentile rankings on 10 topics covered in the World Bank's Doing Business. The ranking on each topic is the simple average of the percentile rankings on its component indicators.
Lao PDR=Lao People's Democratic Republic, PRC=People's Republic of China. The ease of doing business rank is identical with the ease of doing business index. Rankings are calculated for the 2 most recent years. Year to year changes in the number of economies covered, number of indicators and methodology affect the comparability of prior years. Source: GMS Secretariat using data from World Bank. World Development Indicators. http://data.worldbank.org/data-catalog/world-development-indicators (accessed January 2017). http://www.greatermekong.org/statistics/